A Software Architect Blog
Monitoring GraphQL
March 07, 2021
We have been using graphQL at scale for several years. It is important that teams have great visibility of the health of their queries. Also for scale it is important that teams can self serve this data and get alerted to changes that cause issues.
Each query calling the server sends it’s client’s name, their version number and the query/mutation name. For each query we map responses to HTTP codes in a metric plugin, normal GQL behaviour is the response HTTP code is 200 and the error is in the response body. This allows people to understand the health using normal web language.
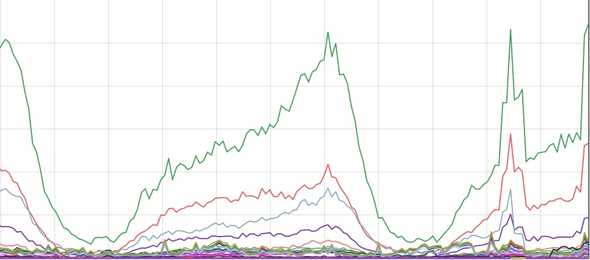
This data is passed to promethesis as metrics then it can be used to visualise the health and volume of queries.Also we have existing alert systems that can be triggered on an increase of 5XX errors in promethesis.
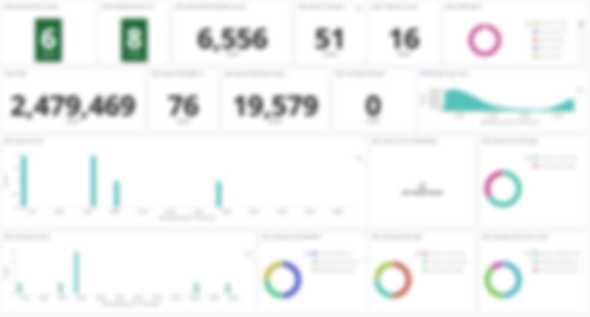
The more detailed information for the queries are logged and this data is visualised in kibana. We have centralised dashboards for the server health. Also we have boards that can be filtered by client name so the application teams can see the health of their queries.
Conclusions
Being able to access data by client with alerting for the application teams allows the management of the system to be distributed between the teams using the GQL platform. Also the centralised teams can look for high volume queries or slow queries to optimise the use of the platform.
Follow me on twitter @andyianriley
or see andyianriley @ linkedin.

